
6 Proven Steps to Maximize Insights from Your Legal Spend Data
Improving rate management to optimize cost-effectiveness of your legal department operations.
By Kris Satkunas, director of strategic consulting of LexisNexis CounselLink
As businesses of all sizes scramble to cut costs and reformulate budgets during today’s economic uncertainty, corporate legal departments are under immense pressure to smartly manage outside legal spend. In turn, this pressure is prompting inside counsel to examine the rates they pay outside counsel and raising questions about what rates are justified. But to properly determine rates they should pay outside counsel, corporate legal departments must use their enterprise legal management (ELM) systems to mine data, analyze it, and make wise decisions.
How do you optimize ELM data to get the answers to your business questions? Below are six essential steps to take.
Step 1: Choose Your Metrics
Consider the questions you need to answer to choose the best metrics. In this case, the goal is to identify where the greatest opportunities are to negotiate lower rates. What metrics will help you best? I’d suggest three are highly relevant:
• Current year timekeeper billed rates – for obvious reasons. This is the current state.
• Change (increase) in timekeeper rates over the last two years – Firms that have increased rates more significantly are likely ones where there is greater leverage to negotiate. Evaluating the percentage change over a two-year period will help to normalize for firms that may have increased rates by a significantly higher amount in one year, but minimally or not at all in another.
• Two-year hours billed – It’s important to focus analytic efforts on areas likely to yield the greatest results. There may be a partner that bills $2,000/hour, but only is engaged on your matters for a couple of hours per year. Bringing a volume metric into this analysis helps keep the focus on what’s most relevant.
Step 2: Organize Your Data
Legal departments pay widely disparate rates for different types of legal work, e.g. work that is largely commoditized vs. work that is unique or requires specialized legal skills. Therefore, when comparing rates paid to multiple firms, it’s critical to look at comparable types of legal work. Most organizations classify legal work by matter type, which will help with this step of segmentation.
Additionally, it’s worth considering whether particular matters have greater strategic value or a larger potential impact on the organization. You may decide that you’re willing to pay premium rates for this type of work, so you want the ability to filter them in/out of your data set and look at them independently.
Step 3: Filter
The matter segmentation referenced in step 2 is one important way to filter data. Additionally, for a billable rate analysis, it’s going to be important to filter data based on timekeeper title (eg. distinguishing between rates paid to partners versus various levels of associates).
Step 4: Analyze & Visualize
In this stage, you’ll evaluate the data you’ve collected to look for the stories it tells. The analytic process typically starts at a higher, aggregate level and then drills down to lower levels of detail to identify patterns vs. outliers. It can be very helpful to have a business intelligence tool that supports data visualization to perform such analysis.
A bubble chart is a useful type of visualization to show the interrelationship of three metrics. In this example, the X-axis represents the two-year percentage increase in rates, the Y-axis represents the hourly rate billed, and the size of each circle represents the volume of hours billed. At an aggregate level, this analysis might start by comparing law firms. Each circle is plotting the weighted average hourly rate (weighted on hours billed) of partners billing from different firms.
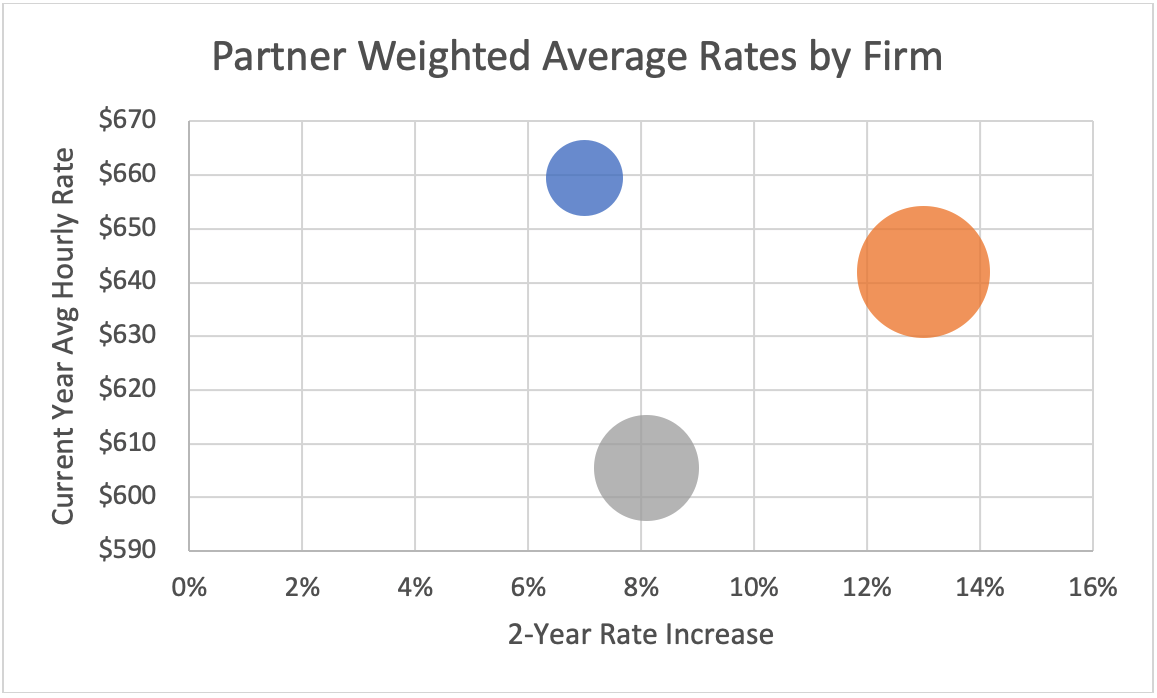
Using a chart like this clearly paints the story that the law firm handling the highest volume (the largest bubble) has increased partner rates the most, and bills average rates that are materially higher than the firm handling the second highest level of volume (the mid-sized bubble). This firm may be a good candidate for rate negotiation.
A subsequent natural step would be to drill to the individual timekeeper level where each bubble would represent an individual partner, colored by law firm. Remember, start at the aggregate level for analytic purposes, and gradually peel back the onion to probe more deeply. Starting at a more granular level can lead to losing sight of the big picture.
Step 5: Benchmark
The analysis up until now has been based on a given corporation’s legal data. Bringing in external benchmarks at this stage will enrich the analysis and potentially help to validate the conclusions drawn from internal data. ELMs such as CounselLink incorporate benchmarking modules into their platforms for just this purpose.
When leveraging benchmark data, it is critical to be discerning in the filtering process so that external data is as comparable to your legal work as possible. The two most important filters to apply to benchmark data are matter type and law firm size. These are the most highly correlated attributes to hourly rates. For example, if in Step 2 when you organized your own data, one of your material buckets of legal work was immigration-related employment matters, you want to look at benchmarks of what other companies pay for immigration work, not the broader bucket of employment work. Further, if you are using mid-size, regional firms to handle immigration matters, make sure that’s what your benchmark data represents as well. There is a tendency to gravitate toward geographic filters when benchmarking rates billed by law firm, but size of firm has a greater correlation to rates than does geography.
Step 6: Leverage
Once you have categorized, filtered, and analyzed your data from your ELM, it’s time to leverage the output to answer the original question – “Where are the greatest opportunities to negotiate lower hourly rates?” Rather than taking a scattershot approach, you’re now armed with data to target firms with the greatest savings opportunities.
These six steps will set you well on your way to determining what your legal department should be paying, and which vendors will help you meet your budget goals. Remember, it all starts with the right questions. Your data will give you the answers, it’s just a matter of tapping into your ELM in the smartest way.