Expectations to excel at work and to do housework, be beautiful and start a family are top pressures
Pew Research Center surveyed 5,078 Hispanic adults, including 2,600 Hispanic women, in an effort to better understand Latinas’ life experiences, the pressures they face and where they find joy. The survey was conducted from Nov. 6 to Nov. 19, 2023, and includes 1,524 respondents from the Center’s American Trends Panel and an additional 3,554 from Ipsos’ KnowledgePanel.
Respondents on both panels are recruited through national, random sampling of residential addresses. Recruiting panelists by mail ensures that nearly all U.S. adults have a chance of selection. This gives us confidence that any sample can represent the whole population (see our Methods 101 explainer on random sampling). For more information on this survey, refer to its methodology and questionnaire.
The terms Hispanic and Latino are used interchangeably in this report.
The terms Latinas and Hispanic women are used interchangeably throughout this report to refer to U.S. adult women who self-identify as Hispanic or Latino, regardless of their racial identity.
Foreign born refers to persons born outside of the 50 U.S. states or the District of Columbia. For the purposes of this report, foreign born also refers to those born in Puerto Rico. Although individuals born in Puerto Rico are U.S. citizens by birth, they are grouped with the foreign born because they are born into a Spanish-dominant culture and because on many points their attitudes, views and beliefs are much closer to those of Hispanics born outside the U.S. than to Hispanics born in the 50 U.S. states or D.C., even those who identify themselves as being of Puerto Rican origin.
The terms foreign born and immigrant are used interchangeably in this report. Immigrants are also considered first-generation Americans.
U.S. born refers to persons born in the 50 U.S. states or D.C.
Second generation refers to people born in the 50 U.S. states or D.C. with at least one immigrant parent.
Third or higher generation refers to people born in the 50 U.S. states or D.C., with both parents born in the 50 U.S. states or D.C.
Throughout this report, Democrats are respondents who identify politically with the Democratic Party or those who are independent or identify with some other party but lean toward the Democratic Party. Similarly, Republicans are those who identify politically with the Republican Party and those who are independent or identify with some other party but lean toward the Republican Party.
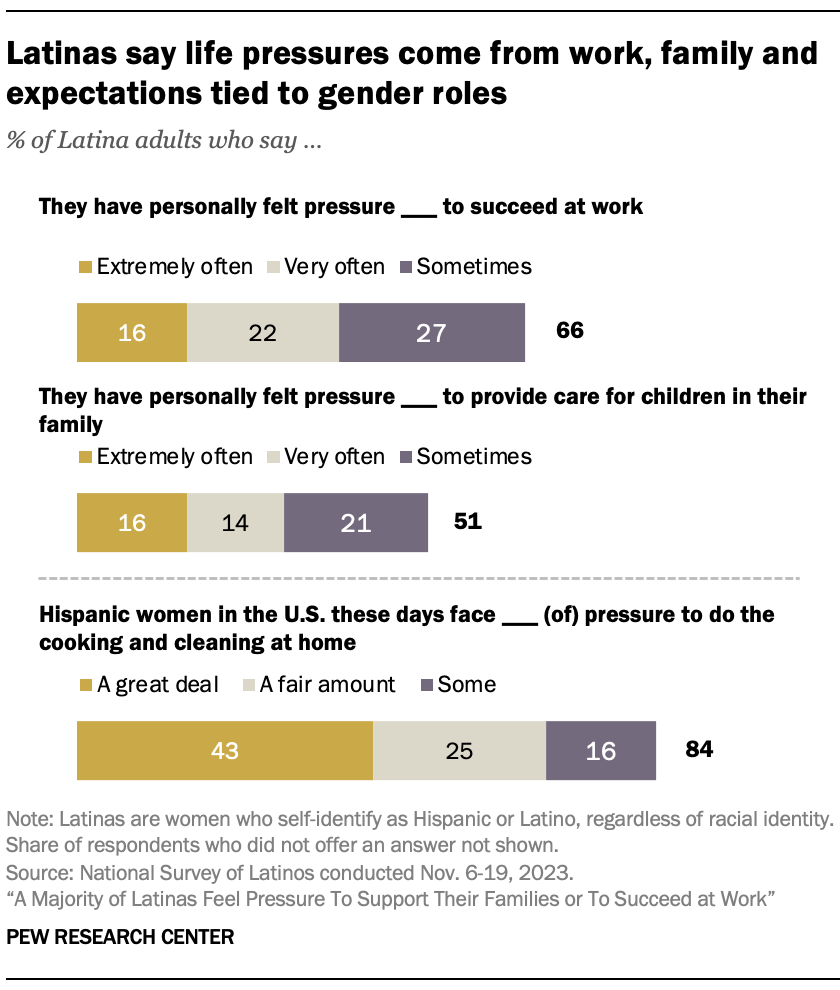
More than half of Latinas say they often feel pressure to provide for their loved ones at home or succeed in their jobs, mirroring the life stressors experienced by women across the United States today.
Latinas feel cross-pressured in other ways too, as they juggle cultural expectations around gender roles rooted in Latin America and those rooted in the U.S. Majorities of Latinas say that U.S. Hispanic women face pressure to do housework, be beautiful and start families.
Despite these life pressures, 88% of Latinas are either extremely or very satisfied (56%) or somewhat satisfied (32%) with their family life. And 86% say they are extremely or very happy (43%) or somewhat happy (43%) with how things are going in their lives these days.
At 22.2 million, Latinas account for 17% of all adult women in the U.S. today. The population grew 5.6 million from 2010 to 2022, the largest increase of any major female racial or ethnic group.
Moreover, most Latina adults have recent immigrant connections, with 77% being either immigrants themselves (52%) or having at least one immigrant parent (25%).1
Some Latinas in the U.S. grow up with traditional cultural values carried over from Latin America. This can produce pressure from family or a community to place the needs of others ahead of their own, be passive or subordinate to others, or be virtuous or chaste – characteristics related to marianismo. At the same time, some Latinas may also feel pressure to achieve success in their own right in academics or a career.
These findings emerge from Pew Research Center’s bilingual National Survey of Latinos, conducted Nov. 6-19, 2023, among 5,078 Hispanic adults. The survey explores what it’s like to be a Latina in the U.S. today.
In addition to life pressures (Chapter 2), the report explores Latinas’ views on sexism against women in media, schools, family and the workplace, and their experiences with harassment and discrimination (Chapter 1). Other topics include Latinas’ views of their general happiness and life satisfaction and where they find joy in life (Chapter 3).
Pressures Latinas say they face at home and work
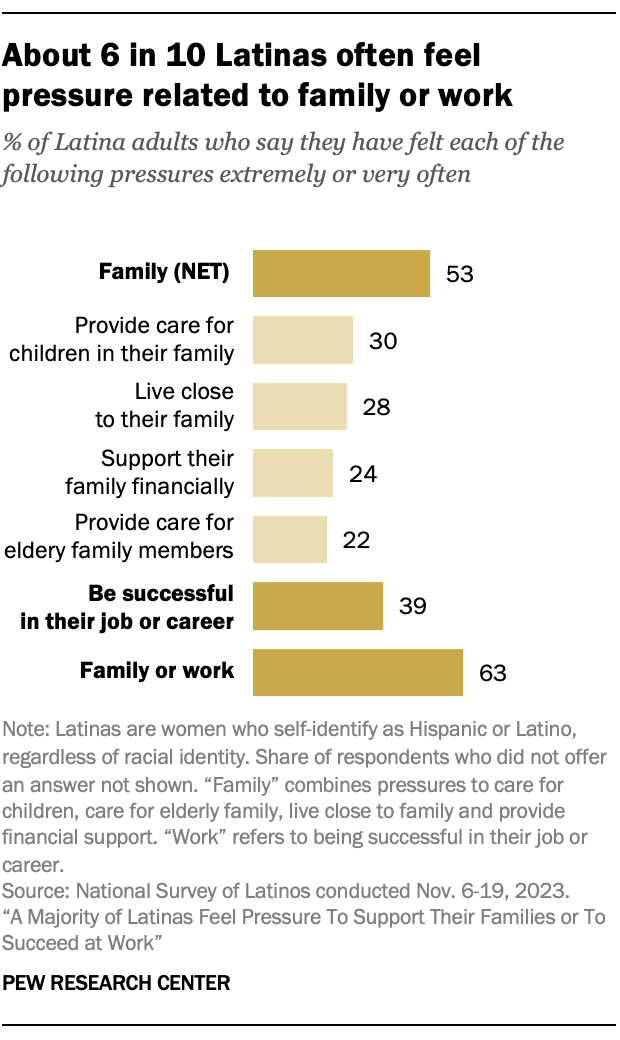
- 53% of Latinas say they often feel pressure to support their family in some way, by caring for children or elderly family members, supporting their family financially or living close to family.
- 39% of Latinas say they often feel pressure to be successful in their job or career.
- Overall, 63% of Latinas say they often feel family pressures or work pressures.
Hispanic men also feel life pressures. About half (49%) of Hispanic men say they often feel pressure to support their family in some way, and 40% say they face pressure to be successful at work. Overall, 59% of Hispanic men say they often feel pressure from family or work.
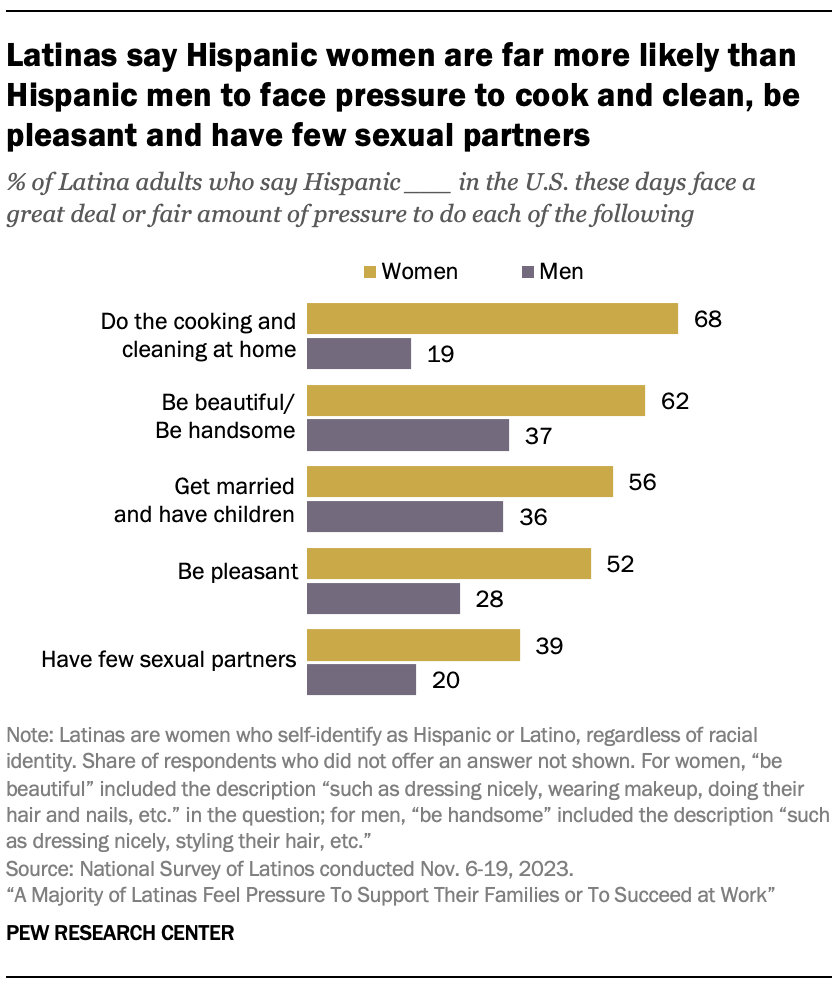
However, Latinas are more likely to say Hispanic women face pressures such as cooking and cleaning at home, being pleasant to others, and starting a family than to say this about Hispanic men. Among Latinas:
- 68% of Latinas say Hispanic women face a great deal or fair amount of pressure to cook and clean at home, compared with 19% who say the same is true for Hispanic men.
- 62% say Hispanic women face pressure to be beautiful, such as by dressing nicely, wearing makeup or doing their hair and nails. By comparison, 37% of Latinas say Hispanic men face pressure to be handsome, such as by dressing nicely or styling their hair.
- 56% say Hispanic women face pressure to get married and have children, while 36% say the same of Hispanic men.
Hispanic men generally agree that Hispanic women face more pressure than Hispanic men to do things associated with gender roles for women. For example, 57% of Hispanic men say Hispanic women face pressure to cook and clean at home, compared with 18% who say Hispanic men face this pressure.
Among Latina adults, those who are U.S. born are more likely than immigrants to say Hispanic women as a group face pressure to do things tied to idealized gender roles.
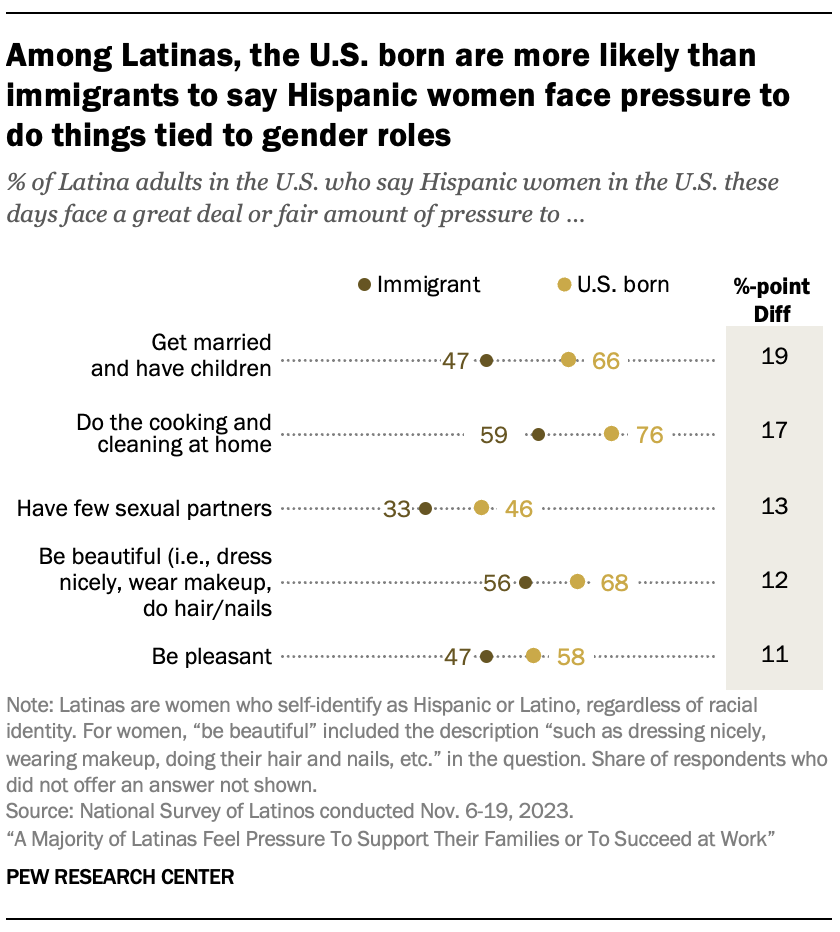
- 66% of U.S.-born Latinas say Hispanic women face a great deal or fair amount of pressure to get married and have children, compared with 47% of Latina immigrants who say U.S. Hispanic women face these pressures.
- 76% of U.S.-born Latinas say Hispanic women in the U.S. face a great deal or fair amount of pressure to cook and clean at home, compared with 59% of immigrant Latinas.
- 68% of U.S.-born Latinas say Hispanic women face a great deal or fair amount of pressure to be beautiful, compared with 56% of immigrant Latinas.
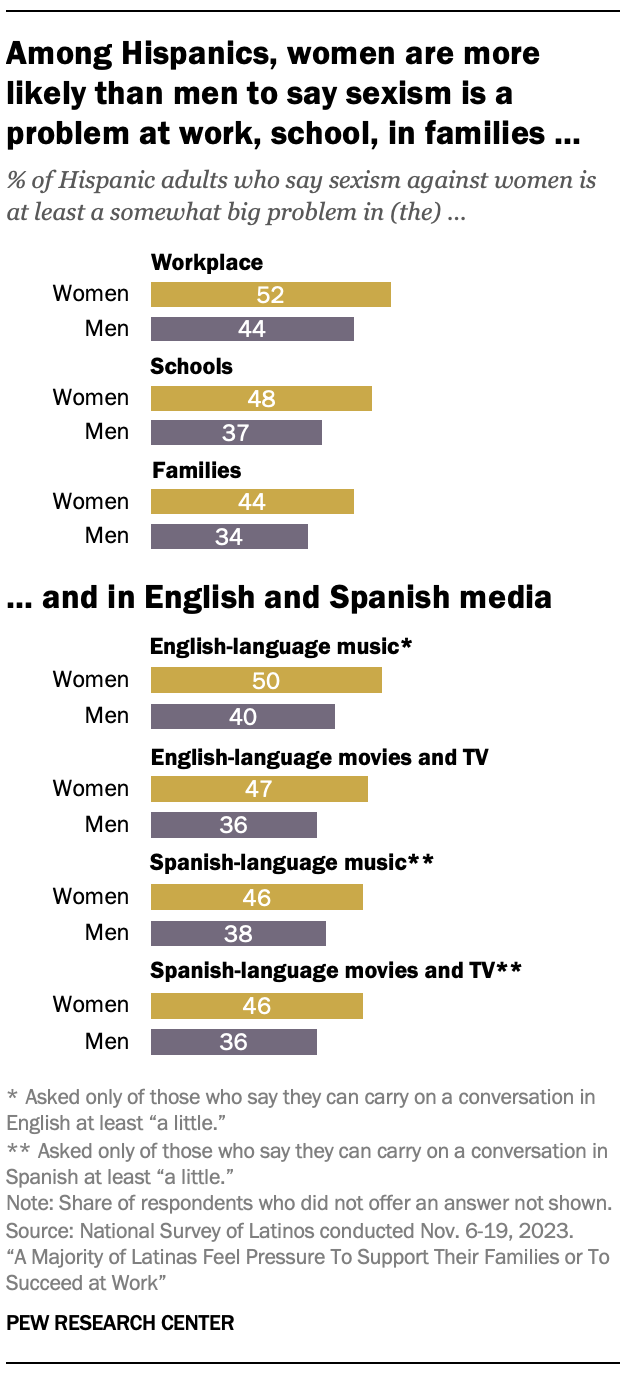
About half of Hispanic women say sexism against women is a problem in different settings, including at work and in entertainment media. Hispanic men are less likely to say so.
- 52% of Hispanic women say sexism against women is at least a somewhat big problem in the workplace, compared with 44% of Hispanic men.
- 48% of Hispanic women say sexism against women is a problem in schools, while 37% of Hispanic men say this.
- Among English speakers, 50% of Hispanic women say sexism against women is a problem in English-language music, compared with 40% of Hispanic men.2
- Among Hispanic adults, 47% of women say sexism against women is a problem in English-language movies and TV, versus 36% of men.
- Among Spanish speakers, 46% of Hispanic women say sexism against women is a problem in Spanish-language movies and TV, compared with 36% of Hispanic men.3
Latinas’ views vary by age on pressures, sexism and harassment
Younger Latinas are more likely than older Latinas to say:
- They often face pressure to succeed at work or live close to their family (Chapter 2).
- Sexism against women is a big problem in the workplace (Chapter 1).
- They have experienced harassment or discrimination in the past year (Chapter 1).
For new research on the economic gains Latinas have made in the last two decades, read “Half of Latinas Say Hispanic Women’s Situation Has Improved Over the Past Decade, Expect More Gains.”


