So much misleading prose circulates these days:
“Manufacturing came back quickly after the recession as it has done in prior recessions, but then flattened out and declined during Obama’s second term.”
At least, I thought this was misleadingly written. At most, well…In any case, I thought it might be useful to look at data (the blue line is the one referred to above).
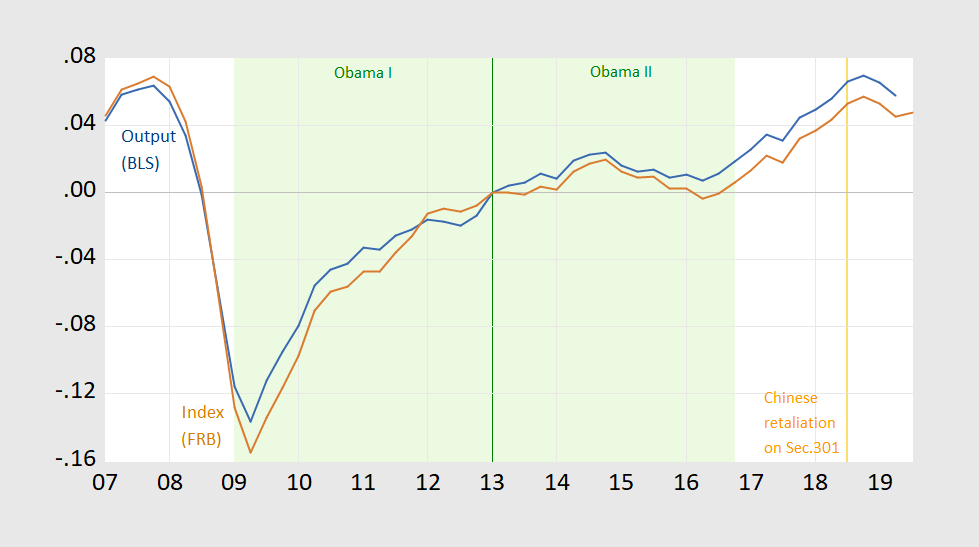
Figure 1: Real output in manufacturing from BLS (blue), and Federal Reserve Board manufacturing production index, quarterly average of monthly data (red), both in logs, 2013Q1=0. Light green denotes Obama administrations. Orange line denotes when China retaliates against US Section 301 measures. Source: BLS, Federal Reserve Board via FRED, and author’s calculations.
In point of fact, by both measures, manufacturing output ends up higher in the last full quarter of the Obama administration than in the first quarter of the second Obama administration…
Of interest is the noted deceleration in manufacturing output after Chinese retaliation against our Section 301 measures is implemented.
Bruce Hall keeps telling us to “go back” to FRED. Of course his mission is to misrepresent the data to bail out the Traitor in Chief. But when one really goes back as your graph does, the facts undermine his Trumpian spin. Who knew facts were Commies!
Let’s look at FRED again. https://fred.stlouisfed.org/series/OUTMS
Q1 2013 = 101.69
Q4 2016 = 103.57
I guess that’s technically not “flat”. I mean, that’s a whopping total increase of 1.849% increase over four years of “recovery” or “growth”. I presume there are externalities that affect manufacturing output besides who is president. We could blame it on tariffs, but as Brad Setser pointed out before Trump’s tariffs:
“Take out U.S. exports of manufactures to Canada and Mexico, and the United States manufacturing exports to the world are about 3 percent of U.S. GDP.” Note: that’s the rest of the world, not just China.
Even with the present downturn in manufacturing output, the index has changed from Q1 2017 = 104.33 to Q2 2019 = 107.72 or 3.2% in two years. Sure, that can worsen. We are ten years into a recovery, so it’s not unreasonable to expect some sort of pause in the general economy based on historical cycles.
But I’ll let pgl provide us all with another ad hominem bit of wisdom.
Bruce Hall: “We are ten years into a recovery, so it’s not unreasonable to expect some sort of pause in the general economy based on historical cycles.” Could’a said that five and half years into recovery too.
Menzie, could have, but why would have? Since the oil shocks, there has only been one recession near 5-1/2 years of the previous recession ending. But at this point, the non-recessionary period is among the longest which, if past is prologue, makes my statement about ten years into a recovery quite plausible… sort of like pulling 44 cards from a deck without pulling an ace and saying that the odds of pulling an ace are getting greater.
That said, do you have issue with the data I referenced in my previous comment?
Every word of what you just wrote is pure word salad sine a shred of evidence to back up this word salad. And we thought Trump was losing it.
pgl, since you can’t comprehend words, how about pictures? https://fred.stlouisfed.org/series/JHDUSRGDPBR
Gee Bruce – caught in a lie and you are still babbling? Do you get your cue cards from Mike Pompeo?
http://econospeak.blogspot.com/2019/10/mike-pompeo-reminds-me-of-al-capone.html
“caught in a lie”???
I reference a specific period under the Obama administration when manufacturing output declined. Why is that a lie? If you are trying to say that did not occur, then I believe you are the one who misspoke. When Menzie changed the time period, I addressed that separately and said yes, the last four years of manufacturing output increase a whopping 1.849% or <0.5% per year versus the last two years under Trump which included the recent decline… 3.2% or 1.6% increase per year.
So, follow the trend… 4 years @ 0.5% and then 2 years at 1.6%. Yup a straight line that shows it was all about Obama leading us onward and upward.
You picked a cherry picked period and you still got the data wrong. Try reading what Menzie wrote very SLOWLY. Maybe you did not lie as we have seen how utterly stupid your presentations of real world data can be. But do babble on as the nurses are walking about ready to take you away to the Cuckoo’s Nest!
“When Menzie changed the time period”.
Menzie is not a cherry picker even if you are. I’m glad you have learned the Trumpian “I’m rubber and you are glue” debating style. Good show troll!
“I guess that’s technically not “flat”.
No it is increasing. But do read that quote of yours that Menzie highlight. You said it was DECLINING. Yes – you lied. Move on troll.
If the same data… <0.5% annual growth… occurred in Trump's administration. would you have a problem with the notion of "basically flat"? Nah.
Bruce,
You linked to a FRED graph from 2016, Menzie links to a BLS one that goes into 2019. Yours is superor why?
Menzie’s shows roughly the following pattern. When Obama took office manufacturing output was plunging. Thenin 2009 it turned arond ad grew very rapidly for somewhat over a year, far more rapidly than during any period later. Then somewhere in late 2010 or so its growth rate suddenly slowed to a roughly steady but positive rate that lasted to somewhere into late 2014 or so, when it turned around and went into a roughly steady but gradual decline into early 2016, when it turned around again and began growing at a roughly steady rate slightly faster then the one durint 2010-14 or thereabouts until the beginning of 2019, when it turned around and began declining again, maybe at about the same rate as during its earlier decline.
Do you seriously disagree with this verbal account, Bruce? Let me note that the period of growth in the first past of Trump’s term was bsicallly just an extension of the growth that began again under Obama in 2016. Are you willing to contest that, Bruce? Your account appears to attempt to do so, but if you are doing so you do not seem to have facts on your side.
If you want to say that Obama had a longer period of manufacturing decline than Trump has had so far and that it did not result in a general recession, that would seem to be accurate, but I do not think I have seen you say that or to admit that the decline turned around to return to growth while Obama was still in office.
“Yours is superor why?”
Because it was endorsed by the stable genius Donald J. Trump. Of course Bruce misrepresents his own source. Then again – lying 24/7 is part of the job description.
See my responses to Menzie and pgl when they are posted by Menzie.
Barkley – if you wish to waste your time with this troll’s incoherent babbling be my guest. I’m done with his worthless rants.
pgl, you haven’t actually contributed anything to the conversation. Your idea of a brilliant retort is attacking someone as a troll. Sorry for you. I speak to the data; you speak to your rear end.
Barkley, the FRED graph on recessions was referenced to discuss time between recession ending and next recession beginning. As far as I know, there was no recession after 2016, so I’m not sure what is your objection.
That is not what you said above, although maybe that is what you meant to say. Sorry, you are still left having made incorrect and misleading statements, such as suggesting that the latest increase in manufacturing started after Trump got in office with Obama having nothing to do with it. This is just plain wrong. Mumbling about times between recessions starting and ending is irrelevant and frankly just plain stupid.
The course of domestic manufacturing output
Is well narrated by bark
If there’s a tale to tell its the unintended bi partisan
Failure to manage our macro instruments effectively
Conjecture
Using macro instruments effectively
We could have sustained a steady recovery rate
Fast enough to even lift manufacturing output
Between 2010 I and 2019 III
WE NEED A MACRO POLICY REVOLUTION
TRUMP GAVE US
A GEO POLITICAL TANTRUM
AFTER OBAMA’S SNAIL REC9VERY
WHAT LOOKS BAD
FEARING THE SHORT RUN MACRO BENEFITS
OF GROTESQUE TAX CUTS UNDER THE DONALD
WHAT LOOKS GOOD
THE MINOR DAMAGE DONE BY TRADE SPATS
Maybe it is time to do some peak to peak comparisons and use the Fed’s estimate of industrial production. Before the great recession both industrial production and manufacturing peaked in December 2007 and appears to have peaked again in December 2018. That should be 11 years. The Feds current economic release sets 2012 equal to 100.
………………………………….12/2007……………………….12/3018
manufacturing………………110.1………………………….106.4
industrial production……. 105.3…………………………110.3
That’s right, on a peak to peak basis manufacturing actually felt
while industrial production rose.
In the initial period after the recession bottomed their recovery was almost identical until 2012,
After 2012 industrial production growth outpace manufacturing growth. Industrial production’
is largely manufacturing plus utilities and mining to include oil and natural gas output.
So the reason industrial production is now growth faster than manufacturing is essentially fracking.
It has virtually nothing to do with either Obama’s or Trumps policies.
I have not checked the data but this has to be the weakest growth since WW II.
l