The Federal Reserve announced today that it will begin reducing the size of its balance sheet next month in very modest and deliberate steps. One reason the Fed is moving so slowly is that they don’t want a repeat of the May 2013 taper tantrum, in which a surprise hint that the Fed might slow the rate at which it would be growing its balance sheet led to a spike up in long-term interest rates. But there may also be another reason why the Fed is contracting its balance sheet so cautiously.
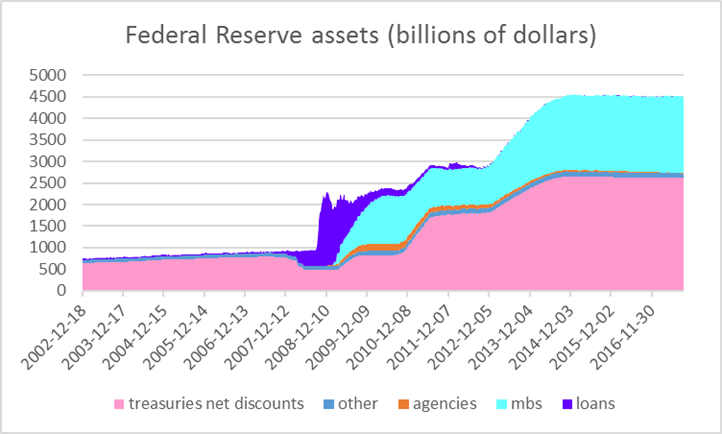
Historical Federal Reserve assets (Wed values, Dec 12, 2002 to Sep 13, 2017). Treasuries net discounts: U.S. Treasury securities held outright plus unamortized premiums on all securities held outright minus unamortized discounts on all securities held outright. Agencies: Federal agency debt securities held outright. MBS: Mortgage-backed securities held outright. Loans: sum of loans, net portfolio holdings of Commercial Paper Funding Facility LLC, Maiden Lane I, II, and III, net portfolio holdings of TALF LLC, repurchase agreements, preferred interests in AIA Aurora LLC and ALICO Holdings LLC, central bank liquidity swaps, and term auction credit. Other: sum of float, other Federal Reserve assets, foreign currency denominated assets, gold, Treasury currency, and special drawing rights. Data source: Federal Reserve H41 archive.
The Fed’s total assets have been steady at $4.5 T for the last three years, with 58% of its assets in U.S. Treasuries and 39% in mortgage-backed securities guaranteed by Fannie and Freddie. It kept the balance sheet steady by reinvesting those holdings whenever they matured. Beginning next month, the Fed will reinvest only some of its maturing securities, allowing its total holdings of both Treasuries and MBS to decline up to certain limits that the Fed spelled out in June. Under that schedule, Fed holdings of Treasuries would be at most $6 B lower by the end of October (a scant 0.2% reduction from current levels), while MBS would be at most $4 B lower. The pace would increase to $12 B and $8 B per month, respectively, in January, with additional accelerations in each quarter of 2018.
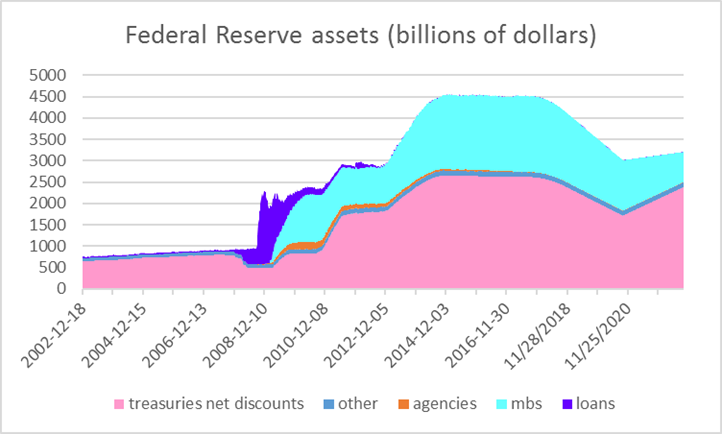
Historical Federal Reserve assets (Dec 12, 2002 to Sep 13, 2017) and projected (Sep 20, 2017 to Sep 28, 2022).
I’ve created a mock-up of what the balance sheet would look like if the Fed reduced its holdings by the maximal amount at a smooth weekly rate (for example, reduce its Treasuries by $1.38 B each week of 2017:Q4, by $2.76 B each week of 2018:Q1, and so on). I also suppose that the Fed maintains the rate achieved by the end of 2018 ($6.9 B per week for Treasuries) through 2019 and the first three quarters of 2020. But these projections assume the Fed will resume growing its balance sheet in 2020:Q4, and never let total assets fall below $3 T. My graph assumes (though the Fed has given no guidance on this) MBS continuing to decline at a $20 B monthly pace beyond 2020, but Treasuries start growing by more than $20 B in late 2020.
The reason the Fed may go back to growing its balance sheet within three years comes from thinking about the liability side of its balance sheet. The big bulge in assets has mainly been financed by extra Federal Reserve deposits held by financial institutions, shown in purple on the graph below. But several other liabilities are also significant– deposits held by the U.S. Treasury’s account with the Fed (yellow), deposits that get returned temporarily to the Fed through reverse repos (orange), and currency held by the public (green). A key feature of those last three is that under current Fed operating procedures these quantities are basically chosen outside the Fed. The Treasury calls the shots for how it manages its account, counterparties can essentially do as much or as little reverse repos as they wish at the rate offered by the Fed, and banks can turn their Fed deposits into cash whenever their customers want more dollar bills. Currency demand grows at a fairly steady, predictable rate, but the Treasury’s account and reverse repos are quite volatile. The reason that total liabilities have remained almost constant week-to-week for three years in the face of this volatility is that Fed deposits of financial institutions have acted as a big buffer, elastically growing or contracting in response to whatever happens at the Treasury or with reverse repos.
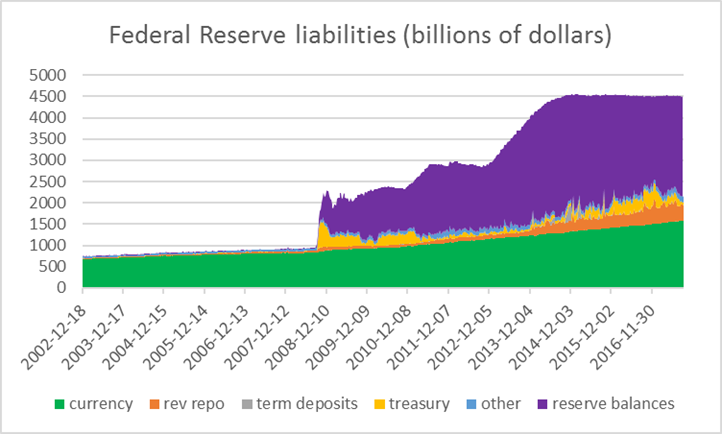
Historical Federal Reserve assets (Wed values, Dec 12, 2002 to Sep 13, 2017). Currency: currency in circulation. Rev repo: Reverse repurchase agreements (foreign official and international accounts plus others). Term deposits: term deposits held by depository institutions. Treasury: U.S. Treasury general account plus supplementary financing account. Other: Treasury cash holdings plus foreign official, service-related and other deposits plus other liabilities and capital. Reserve balances: reserve balances with Federal Reserve banks. Data source: Federal Reserve H41 archive.
To get a visual picture of how Fed liabilities might evolve, I assumed that currency continues to grow at its recent historical pace. And to represent potential future volatility in the reverse repos and the Treasury’s balance, I simply assumed that the numbers for each of those series for Oct 2017 to Sep 2019 took exactly the same values they did for Oct 2015 to Sep 2017, and cycled through the same sequence again starting in Oct 2019.
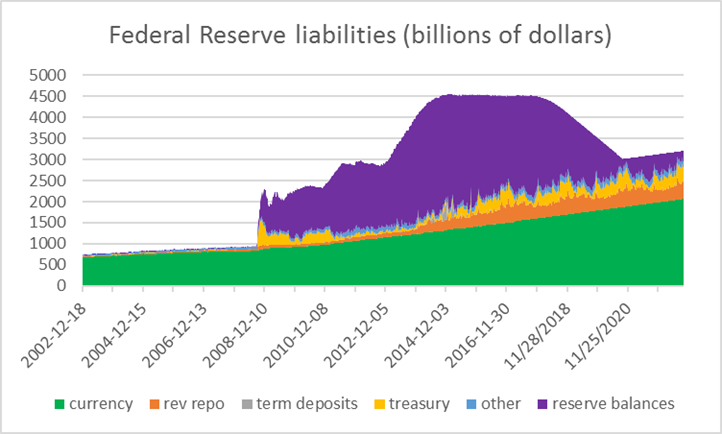
Historical Federal Reserve liabilities (Dec 12, 2002 to Sep 13, 2017) and projected (Sep 20, 2017 to Sep 28, 2022).
The picture shows what would happen if the Fed were to continue reducing its balance sheet through the end of 2020. There would still be a very high level of Fed deposits by financial institutions on average by the end of 2020. But that’s not enough to cover the plausible variation in other Fed liabilities. For example, data from the New York Fed show that outstanding reverse repos went from $92 B on Nov 17, 2016 to $468 B on Dec 30. It takes a lot of reserves sloshing around the system to cover that kind of variation.
Of course, there are other changes the Fed may consider to its basic operating system, such as changing the way it conducts reverse repos, using temporary open-market operations to add or withdraw reserves as needed to offset changes in the Treasury balance, or moving to a true corridor system for controlling interest rates.
The gradual pace of contracting the balance sheet gives the Fed a couple of years to sort out how it’s going to do that.
Nice post — helpful (at least to me) visualization of how both sides of the fed’s balance sheet are likely to evolve.
Why unwind and effectively burn $4trillion. Why no move it into the highway trust fund, the social security trust fund, and other places that need the money.
Your succinct & timely explanations never fail to do the job.
Curious if there is any reason behind a) the Treasury’s increased absolute holdings since the balance sheet expansion and b) the (seemingly) random and large relative variability in Paulson, Geithner, & Lew’s holdings?
To be clear, I don’t mean the variability between the Secretaries, but rather the seemingly high volatility of Treasury’s holdings relative to the other components of the Fed’s liabilities.
rtd: One factor may be the added uncertainties for Treasury cash management that come from difficulties in getting debt bills through Congress. The Treasury Department perceives a need to maintain a higher balance on average but also to use the cash more intensely.
Rtd and Jim Hamilton, the plan is to use accounting offset of monies in the Treasury General Account as the Fed refuses to remit the principal payments back to Treasury as surplus so they require Treasury to carefully manage cash positions.
They can over borrow, work with OMB and the agencies to slow down payment claims or slow diwn in paying them, or work across the agencies to effect Impoundments (unlawfully so) as ways to increase the cash in the Treasury General Account.
The Fed should not be inducing such behavior. And I do not know why Treasury would or should agree to the offset elimination of the public’s cash as they redeem the bonds. If they are being induced to borrow they should make the Fed take the cash when redeeming – the optics of an incredibly rising cash account at the Fed would cause more political leverage in the Trump Admin’s hands, in my opinion.
If I were the Fed I’d publicize that redemption amounts create additional surplus that they would by law just remit to Treasury, so why not just offset eliminate bith positions before Treasury has to borrow (just to get tye monies handed right back to them).
You want leadership – the Fed can show the public that the public debt can shrink immediately if Treasury would just agree (indeed, we owe this to ourselves, printed the money in the first place, now we can redeem the entire book if we want to do so).
So the currrent plan is to use accounting offset, I am saying that responsible leaders would agree to the non-borrowing offset elimination instead.
Just a guess: The creation of reserves as a reflationary tool is mirrored by extinguishing reserves when the need for reflationary policy is ended. The Fed took Treasury debt onto it’s books as a temporary measure – and claimed it was not monetizing the debt. Extinguishing the debt means monetizing the debt permanently.
In the post-Wiemar world, we try to avoid the impression that we are monetizing public debt.
Thanks, Jim. Good to know you still breathe.
Here’s a question for you regarding regimes.
Depressions show markedly different economic and social dynamics than ordinary recessions. For example, we see persistent low interest rates, low population growth, low productivity growth, and sluggish GDP recovery, for example.
On the social front, we see a rejection of the established political system, eg, Brexit, Trump and Macron, an exaggerated ideological polarization (fascists v communists fighting in the street), and active steps to deport illegals (also occurred in the 1930s).
One has to speculate as to what could cause such a prolonged malaise. Gavin Davies takes a crack at the issue:
“The graphs above show a simple version of the Taylor Rule, comparing the appropriate rate (red line) with the actual policy rate set by the central banks (black line). The graphs contain a simple but clear message: because of the constraint imposed by the zero lower bound, policy were much higher than the appropriate rate for the ECB from 2009-16, and for the Federal Reserve from 2009-14. Now, the rise in the appropriate rates has taken policy into slightly expansionary territory in both the ECB and the Fed, despite the rate rises introduced in the US.”
This interpretation suggests that real interests were too high in the aftermath of the Great Recession, and therefore investment, and perhaps productivity growth, were too low. With Taylor Rule interest rates now above target, the economy may begin to operate well again, with productivity growth rebounding and GDP growing nearer (or above) its historical range. Oil consumption growth — above 2 mbpd / year for the last two quarters — and strength in oil prices suggest this might be true.
We know from the Great Depression (for which I have not seen Taylor Rule analysis) that the US struggled through the 1930s, but doubled its GDP from 1941 to 1947, and did not fall back materially with the end of WWII (although there was a stiff post-war recession). We are now at a similar turning point, which would seem to either end in war or in a burst of renewed growth.
I would welcome your thoughts in a post.
https://www.ft.com/content/0c6cfd54-b4c4-345b-a530-ae2b25967746
Interesting remarks, Steven Kopits. And I agree we are now at a similar turning point.
I know you didn’t ask for my thoughts in a post, but:
https://newarthurianeconomics.blogspot.com/2017/09/burst-of-renewed-growth-steven-kopits.html
Does the Fed have a clue about what it is doing? After all, we know that after the housing bubble had already popped the Fed could not see the reality and was making all kinds of projections that no rational individual would consider consistent with the data or even with each other. Given the fact that most players are on the long side, what happens when a large institution like the Fed decides not to play the game any longer? If I were a pension plan that held the type of ‘assets’ that the Fed will be divesting itself of, why wouldn’t I get out before the Fed acted? And given the optimism levels, for how long are the bubbles in sovereign debt, mortgage backed securities, and equities sustainable? How long until some of the big players cash out and park their holdings in physical gold or tangible assets that cannot be created out of thin air?
85 percent of all complicit reserves are met with the average bank’s applied vault cash. And contrary to Bernanke, there’s no “signaling channel” involved.
The monetization of assets by the Fed won’t be un-wound. Roll-off means that the Treasury will recapture the proceeds from maturing securities not reinvested (passive tightening). The existing supply of loan-funds won’t be affected. I.e., the Fed won’t sell into the market, as doing so, would skew the distribution of sales towards non-bank counterparties (those without the benefit of arbitraging the policy rate), thereby draining the money stock (not neutral “normalization”, but a contractionary FOMC policy).
What I’d like to see from the Fed (micro-economics, as bank credit expansion is a system process), is a listing of “master” and “pass thru” accounts (not their actual names), by size, FBO vs. domestic bank, and District Reserve. I.e., I’d like to know how IBDDs are skewed in the payment’s system.
The current mal-distribution of IBDDs (concentration by money center and FBOs), has empirical grounds (restriction of oligopoly, monopsony, and monopoly elements), the panics ensuing between the former Central Reserve City Banks, vs., Reserve City Banks, vs. Country Banks. This structure precipitated bank panics, accumulated pressures between respondent/correspondent relationships, as the Fed’s country banks classification held upwards of ½ of all vault cash.
“The payment of explicit interest on reserves held by U.S. banks is not a new idea. As discussed by Weiner (1986), prior to passage of the Federal Reserve Act in 1913, U.S. banking laws permitted nationally chartered commercial banks to include correspondent balances earning pecuniary interest as legal reserves for purposes of meeting reserve requirements. In addition, individual state authorities also permitted state‐chartered commercial banks to include interest‐bearing correspondent balances as legal reserves, and some also allowed state banks to count interest‐bearing government securities.”
Bank credit creation is a systematically transmitted process. So the system’s cumulative impact from balance sheet normalization is dependent upon its micro-economic parts (the volume and distribution of *free* reserves, whether individual bank’s IBDDs are net neutral, not *borrowed*, or skewed and mis-aligned, aka, the FBOs). When there are bankable opportunities, bank lending is mutually reinforcing, allowing each individual bank to expand by several times its previous excess-reserve position, producing a superstructure of credit.
Conversely, the process by which a reduction in deposits in one bank affects the other banks in the system reverses the steps by which the creation of deposits in one bank is ultimately spread to the other banks in the system. Contraction by any single bank in the system will place pressure on other banks (forcing the calling of loans or “run-off” without renewal), and if their excess-reserve position is inadequate, and the banks are unable or unwilling to replenish their balances, e.g., discount assets with the Central Bank, disorderly and volatile markets might ensue (and commercial bank credit expansion has already been slowing). That is, the contraction process does not mimic the same numerical sequence as it did during the expansion process.
i would be profitable too if i could print money and buy real assets making me real dividends every month like the fed does
Yes, but the point was to inject liquidity into the system, to create demand deposits, and raise the value of those assets, in the marketplace, including mortgage backed securities.
The lucidity and certainty of the oscillating crests and troughs is revolutionary. Lending by the commercial banks is inflationary. Lending by the non-banks is non-inflationary. The one-time expiration of the FDIC’s unlimited transaction deposit insurance temporarily activated existing money (forced savings back to work through the non-banks and non-bank counter-parties), and thus was directly responsible for the mis-labeled and mis-leading “taper tantrum”. Hence my forecast on 12-16-12, 01:50 PM “Jan-Apr could be a market zinger” was yet another “predictive success” and prima facie evidence of this upcoming reversal in the flow of funds.
As Nobel Laureate Dr. Milton Friedman (a skilled mathematician, but lousy economist), said: “The only relevant test of the validity of a hypothesis is comparison of prediction with experience.”
However, raising the remuneration rate acts in the opposite direction, idling savings (inducing dis-intermediation, where the size of the non-banks shrink, but the size of the commercial banking system remains unaffected). I.e., there becomes a substantive nominal change, a decrease in the supply of loan-funds, but no change in the supply of money. It is a velocity relationship, where M*Vt = aggregate monetary purchasing power, AD.
Raising the remuneration rate destroys money velocity (chiefly savings velocity within the payment’s system). 2017 would have otherwise demarcated reflation. In contradistinction to Janet Yellen’s “Inflation Shortfall Is a ‘Mystery”, there is no such conundrum. Janet Yellen’s rate hikes were accidentally prescient:
As I have repeatedly said: “The economy is behaving exactly as it is programmed to act. Raise the remuneration rate and in a twinkling, the economy subsequently suffers. The Fed’s 300 Ph.Ds. in economics don’t know the differences between money and liquid assets. Apr 28, 2016. 11:25 AMLink
The biggest news is that these movements tie together all enigmatic economic forces. I.e., money is not neutral as Bankrupt u Bernanke postulated. Money is robust, having a “ripple effect” (Yale Irving Fisher’s pioneering distributive lag effect of money flows):
“Neutrality of money is the idea that a change in the stock of money affects only nominal variables in the economy such as prices, wages, and exchange rates, with no effect on real variables, like employment, real GDP, and real consumption.”
Economics is an exact science. As Edward Meadows said: To sit at one’s desk and solve the total differential of the Utility Function is to taste of the Universal Laws: action and reaction, velocity and stability—the world’s maelstrom reduced to a paradigm of Newtonian determinism, the baleful imponderables of human life revealed in the technical investigations as to the signs of a small few partial derivatives….