
New York City is notorious for its large rat population, and Mayor Bill de Blasio is eager to do something about it. Last Wednesday, de Blasio’s administration announced a $32 million Neighborhood Rat Reduction Plan, which could reduce rat activity by up to 70 percent in select zones. Some might consider any double-digit reduction in rat action ambitious. After all, New York City has fought the vermin to a stalemate for more than a century.
But the current administration is not afraid of making bold claims. Indeed, incredible levels of progress appear to be the norm for this mayor: In 2013, de Blasio’s Operation Crew Cut reported a 50 percent decrease in homicides among select young people. In 2015, the Mayor’s Action Plan for Neighborhood Safety reported an 11 percent decrease in violent crimes at select New York City Housing Authority developments. And just this February, Vision Zero reported a 27 percent decrease in pedestrian fatalities on select roads.
These impressive statistics emanate from the city’s government website and are also broadcasted to residents via local billboards and now even high-tech phone booths. Their purpose is to provide evidence of progress.
It sounds great, and it looks even better. The only problem is that the progress reported is rarely sustained at the initial level in subsequent years or when the policy is expanded to additional areas. The 50 percent decrease in homicides was undermined by a 23 percent increase over the next two years. And the 11 percent decrease in violent crimes was practically reversed by a 10 percent increase the following year. I’ll get to Vision Zero in a moment.
What’s going on here? Is it the policies that are flawed? Probably not—the inability of the current administration to sustain impressive decreases seldom reflects the policies themselves. Rather, too often the decreases were erroneously cited as evidence of progress in the first place. The de Blasio administration has fallen for the oldest statistics trick in the book: failure to acknowledge a “regression to the mean,” also known as the regression trap.
It’s a frustrating cycle for everyone. They make this mistake, thinking they’ve achieved exceptional progress (which they quickly broadcast), and then they struggle to replicate their success elsewhere. A better understanding of statistics can help.
Regression here refers to the statistical phenomenon that exceptional events are usually just that: exceptions, not the norm. For example, the genes inherited from tall parents generally produce shorter children. The student with the highest score on one test is unlikely to do as well on the next. And locations with the highest crime tend to exhibit lower crime the following year.
This phenomenon allows policymakers to conjure decreases at will by simply following exceptional events. When a new policy is brought into the mix, it is all but impossible to figure out how much of the drop was due to the new policy and how much was just an adjustment back to the norm.
For example, the figure below compares the number of violent crimes reported each fiscal year for different groups of NYCHA developments. The first panel displays 13 developments in the Mayor’s Action Plan for which data was available. The decrease following the adoption of the plan between 2014 and 2015 is apparent. But a decrease of this size is hardly remarkable. The current administration could cite similar evidence by showing the drop in crime from 2013 to 2014 in the middle panel or 2012 to 2013 in the last panel. The advertised policy did not yet exist in either year, but crime was exceptionally high in these areas, so a drop would be expected.
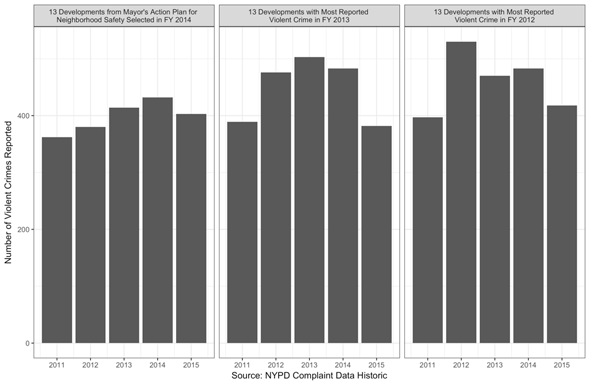
Jonathan Auerbach
This is not to say targeting high-crime areas is bad policy. But a large decrease does not imply transferrable progress when selected areas were likely to experience decreases anyway.
A similar argument can be made for New York City’s traffic safety policy, Vision Zero. The Vision Zero Task Force reviewed the location of vehicle-related fatalities and serious injuries between 2009 and 2013. These locations were prioritized for improvements. After three years of policy changes, the committee concluded:
The City’s strategy of concentrating engineering and enforcement resources in priority corridors, intersections and areas is working. Pedestrian fatalities at these locations declined 27 percent in 2016 compared to the five years before Vision Zero.
That 27 percent decrease in pedestrian fatalities is more than three times the citywide percent decrease, so it’s tempting to attribute the difference to the policy, as the task force did. But the conclusion does not fit the data. The following figure shows a concurrent 25 percent increase in fatalities happening at the remaining nonpriority locations. If a 27 percent reduction at priority locations is evidence of progress, certainly a 25 percent increase at nonpriority locations suggests a sizeable setback. But it’s unclear how concentrating engineering and enforcement resources on priority locations would account for the increase at nonpriority locations.
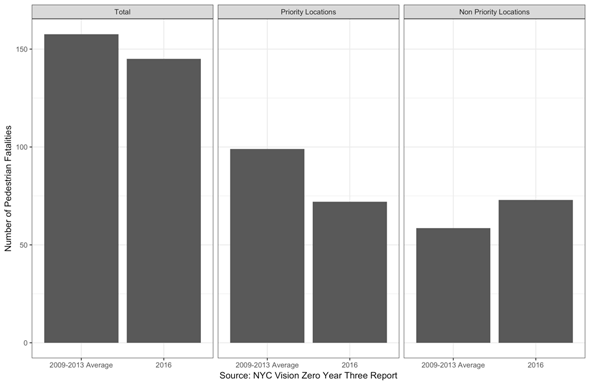
Jonathan Auerbach
More likely, Vision Zero is behind neither the increase nor the decrease. Instead, the regression phenomenon better explains the pattern observed in the data. The committee prioritized locations with an exceptionally large number of fatalities. The fatalities on these selected roads were due not only to dangerous conditions in need of repair but also to coincidence, uncharacteristic of those roads and unlikely to repeat itself. The total number of fatalities on priority roads was therefore predisposed to revert back to normal levels from the high levels observed before Vision Zero when measured in subsequent years, regardless of any policy change.
The same can be said for the non-priority locations. These had exceptionally low numbers of fatalities, perhaps due to safer conditions but also likely due to chance, and so they were inclined to rise. Since changes at priority and non-priority locations are expected, it is inappropriate to advertise the 27 percent decrease as if it were evidence of progress.
Failure to account for the regression phenomenon is by far the oldest statistics trick in the book. Sir Francis Galton documented the phenomenon back in 1889, anticipating modern statistical practice by nearly half a century. Yet despite its celebrated history, data users, including the current administration, continue to fall for the trick. In 1992, Milton Friedman suspected regression to be the most common fallacy in the statistical analysis of economic data.
All this suggests the de Blasio administration will easily achieve its stated goal of reducing rat activity by 70 percent in the zones it selects. Its announcement follows a pilot program that selected six sites with high concentrations of rats and recorded a more than 80 percent drop in active rat signs. A similar reduction would be expected by targeting sites with high concentrations of rats in the same way.
But if the rat reduction plan reaches its target, the administration cannot blindly interpret the drop as evidence of progress or a justification of the $32 million price tag. Whether a 70 percent reduction is achieved in select zones is likely due to which zones the administration selects and not necessarily the measures it introduces. It does not mean that low rat populations will be maintained in subsequent years or when the policy is expanded to the entire city.
There are no quick fixes that will make the statistics more closely reflect the policy. The simplest course of action may be to avoid making select comparisons in the first place. Not every press release needs to be punctuated by an impressive-sounding statistic. A 70 percent reduction in rat signs might sound good—but what city residents would like even better is a plan to reduce the number of rats in reliable ways over the entire city over time, not just one that capitalizes on outliers to suggest progress.